ArcMap and ArcScene Map Creation
Created map located under 'Figures' Page...
*
Why are proper cartographic skills
essential in working with UAS data?
It
is very important to be able to show your audience your UAS data in a clear and
concise manner. Illustrating a map is a very effective way to do so. It shows
your audience the important features of your data set, the direction reference
with a compass rose, and even key flight data such as time, date, etc.
* What are the fundamentals of
turning either a drawing or an aerial image into a map?
A
drawing/illustration needs a few things to become a map: a scale, a legend, a
coordinate system, watermark, and attribute data. If it is missing one or more
of these components, then it is technically not a map. A scale and coordinate
system give those viewing it some insight into the image they are looking at. A
legend explains key features of the map, and attribute data is used to provide
key flight information. The watermark is essential in making your data yours. Otherwise,
your map can be taken from you with no proof of it being your creation.
* What can spatial patterns of data tell the reader about
UAS data? Provide several examples.
Spatial
patterns can illustrate a picture for the map’s readers. By demonstrating a
certain arrangement of data, the reader can recognize the point that the
creator is trying to get across. In forestry, if the reader notices a pattern
of less tree growth around certain areas of a forest, he/she will be able to
assess the situation in the manner they deem fit, whether it be because of lack
of water, sun, infestation, etc. In accident reconstruction, someone can notice
the tire mark patterns traveling a certain way and can then attempt to
determine point of origin of the accident.
* What are the objectives of the lab?
The
objectives of this lab are to teach us students the key attributes to make a
map. After learning what is needed to make a map, we will learn how to create
one using the ArcMap and Arc Catalogue software to turn our datasets into a
readable map.
o What key characteristics should go into folder and file
naming conventions
When making folder names, you should keep track of the name
of the project, as well as the date associated with it. That way you will be
able to search for the folder using one of two methods. In terms of
organization, it is probably most beneficial to organize by date so you can
find your most recent projects easier.
o Why is file management so key in working with UAS data
UAS data incorporates hundreds and thousands of GB of data.
If strewn all over the place, it becomes incredibly easy to lose track of your
data, completely ruining your projects. Keeping your data clean and organized
will also allow the computer to process the information quicker.
o What key forms of metadata should be associated with
every UAS mission
Tools used to collect the data, specifics on the tools used
such as name, platform, etc., the data set coordinate system and projection,
and the time and date of the data collection.
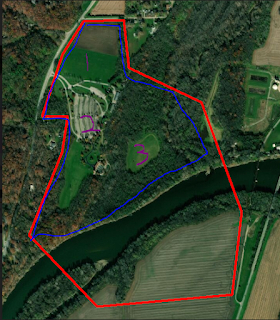
o What basemap did you use? Why?
I used the satellite image basemap, because I like seeing
the surrounding terrain to help me visualize where we are.
o What is the difference between a DSM and DEM?
DSM – digital surface model, captures the natural and built
features on the Earth’s surface
DEM – Digital Elevation Model, this voids out vegetation
and man made structures to illustrate the bare earth elevation
o Cell Size, Units,
Projection, Highest Elevation, Lowest Elevation
o Enter those statistics into a table. Why are these
important?
These data points are important to the reader because
typically, this information will help to understand the image. It gives extra
meaning to the map as well as reference to what the reader is looking at. The
different colors in elevation are nice, however knowing the actual altitude of
the highest and lowest points gives scale to the shading.
o What does hillshading do towards being able to visualize
relief and topography.
The hillshading sharpens the sides of the altitude changes
to give the reader a better understanding of what they see.
o How does the orthomosaic relate to what you see in the
shaded relief of the DSM
The shaded relief shows the elevation change concisely,
whereas the orthomosaic shows vegetation differences as well as you can better
see objects in the orthomosaic than in the shaded DSM. While you can
distinguish elevation in the DSM., you can distinguish objects in the
orthomosaic.
o What is the purpose of vertical exaggeration?
The vertical exaggeration better illustrates the differences
between the base height and the top elevation value.
o What color ramp did you use? Why?
I used a color ramp with blue as the low altitude and red
as the high altitude. I chose this setting because my mind relates it to
something being cool or hot. The low elevations are lower, therefore they are
cooler than the higher elevations.
o What are the advantages of using ArcScene to view UAS DSM
data vs. the overhead shaded relief in ArcMap. What are the disadvantages?
By viewing the dataset itself, a reader is able to
conceptualize the number differences, however an overshaded relief is also
beneficial for someone that cannot conceptualize the UAS DSM data in ArcScene.
o Is this export a map? Why or why not?
No, this is just an image. We are still missing key
elements such as: legend, scale, direction, scene map, metadata, etc.
* Summarize what makes UAS data useful as a tool to the
cartographer and GIS user
UAS
data can help a cartographer generate an aerial map. A UAS can cover a large
area and stitch together data to create an orthomosaic that can then be turned
into a map after proper steps are taken. For a GIS user, they can take the data
captured by the UAS and convert that into job-specific pertinent information.
Whether it be plant development, construction progress, or anything else it can
be used in GIS to help solve a specific problem.
* What limitations does the data have? What should the user
know about the data when working with it.
The
data is limited to a certain factor of accuracy. That should be explicitly
stated when it is handed over to the user, so they are aware how certain they
can be in the data provided. Hopefully the data is captured to a certain degree
of certainty that is deemed acceptable by the user.
* Speculate what other forms of data this data could be
combined with to make it even more useful.
This
data could be combined with weather patterns throughout parts of the year to
aid in crop vegetation. Or the data could coincide with different civil
engineering data so they can speculate how to develop the land.

Comments
Post a Comment